
Machine Health Event Triage Across OEM Systems

Overview: A large surface and underground gold mine in Nevada was generating tens of thousands of machine health events every day across multiple OEM systems, making it hard to know which events needed action. MTS developed the Events Triage Board within the Asset Health Centre to bring these events into one common view, flag significant patterns using configurable frequency and duration rules, and link each flag directly to investigation tools. As a result, the site now has a more structured and repeatable approach to triage, focusing on the events that drive maintenance decisions rather than the volume of alarms.
The requirement
A large mining operation was generating tens of thousands of machine health events every day across multiple OEM systems.
The challenge with this high volume of data was knowing which events mattered, which could be monitored, and which required action.
The site needed a consistent and repeatable way to:
identify significant health events
understand their frequency and context
prioritise issues for investigation
support consistent escalation and follow-up
MTS was engaged to develop a structured triage framework within the Asset Health Centre (AHC) to help the site turn this high-volume event stream into meaningful priorities.
The challenge: finding the signal in the noise
A mining fleet can generate tens of thousands of health events every day across different OEM systems, machine classes and severity levels.
Some are expected or operationally insignificant. Others may be early indicators of an equipment problem.
The difficult cases often sit somewhere in between.
Picture a truck that generates ten Level 2 “Engine Derate” events over ten hours. What happens next?
Does it need to go to the shop?
Should it be parked?
Can it safely complete the shift?
Or is it something to keep monitoring?
At fleet scale, making those calls consistently is hard, especially when the data comes from different systems with different naming conventions.
The site was dealing with:
Tens of thousands of health events per day from several OEMs and third-party systems, including CAT VIMS, Komatsu VHMS, Sandvik Optimine, Newtrax and VisionLink.
Different OEM event codes, naming conventions and data structures.
Operational noise from FMS upgrades, sensor issues, PM-triggered events and ECMs being swapped between machines.
Inconsistent machine and class naming.
Recurring low-severity events that could become significant when viewed as a pattern rather than as individual events.
For an analyst, particularly one less familiar with the fleet, the question wasn't simply “What events occurred?” It was: “Which of these events deserve my attention?”
The approach: turning events into actionable priorities
The Events Triage Board was developed as part of the AHC framework to give analysts a structured way to answer that question. It brings together three key capabilities.
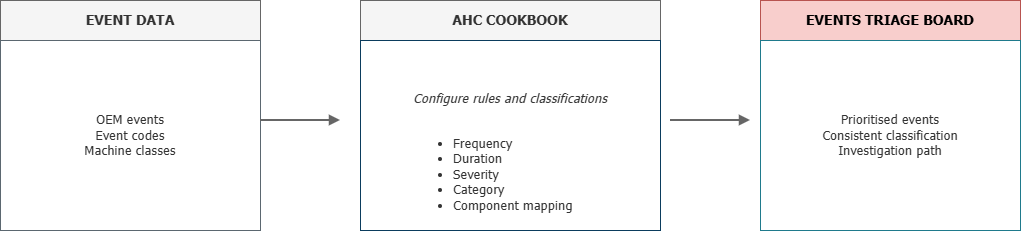
Health Events Triage is part of the Asset Health Cookbook
1. Turn event patterns into a triage decision
Instead of looking at an event in isolation, the dashboard considers how often it occurs and how long it persists.
Triage rules are configured through the AHC Cookbook using two independent checks:
Frequency: does the event occur more often than the configured threshold?
Duration: does it persist longer than the configured average duration?
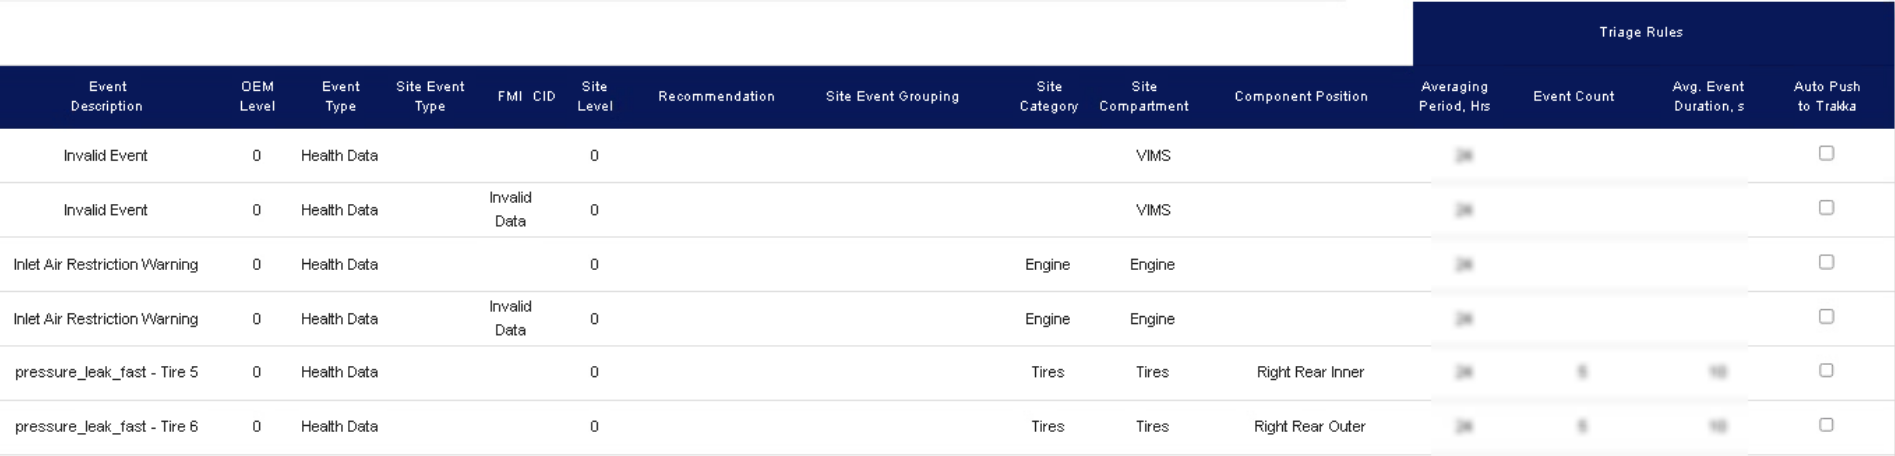
AHC Cookbook Events Configuration Layer
This turns a general instruction such as “investigate recurring events” into a configurable and repeatable process.
The result is a more consistent way of identifying events that warrant further investigation.
2. Create a common language across OEM systems
The same equipment issue can look very different depending on which OEM system generated the event.
The Events Triage Board brings events from systems including VIMS, VHMS, Optimine, Newtrax, VisionLink, iTrack into a common view.
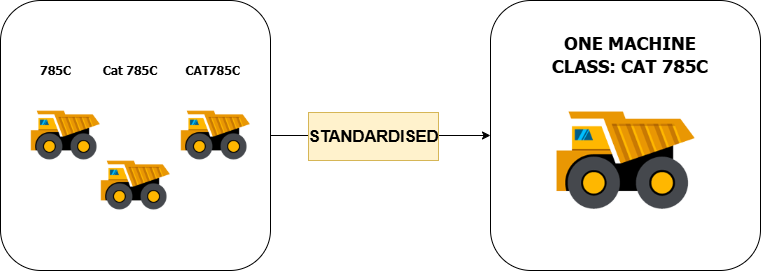
Within the AHC Cookbook, analysts can standardise event descriptions, severity, categories, component mapping and machine classes. Less time working out what an event means and more time understanding what it might mean for the equipment.
3. Connect the flag to investigation
Once an event is flagged, analysts can move straight into the relevant tools from the Triage Board:
EDI - Equipment Data Interface: high-resolution datalogger and machine snapshot data.
CBT - Component Based Troubleshooting: component-level troubleshooting.
SIS (CAT Service Information System): service and technical information.
HRE - Haul Road Explorer: equipment location and haul-road context.
The investigation can also be enriched with additional information, including oil sample summaries, Dingo Trakka feedback, work order history, SAP information and likelihood-of-breakdown indicators.
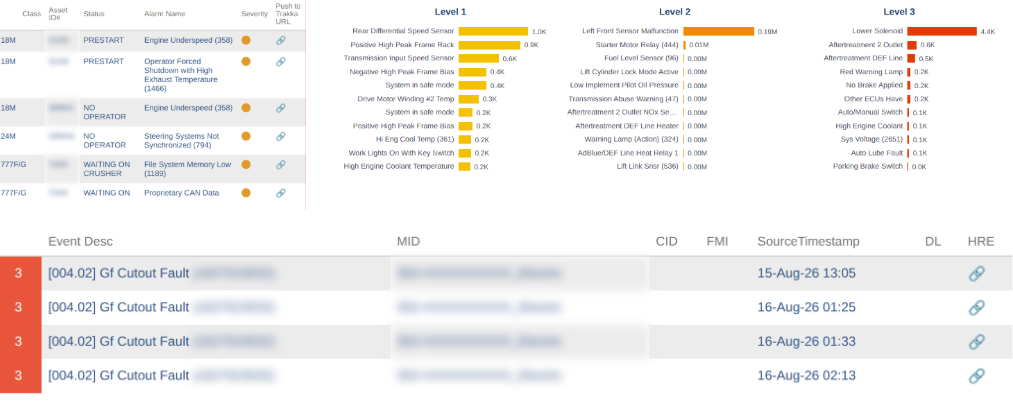
Events Triage Board - it provides a common view of prioritised events and supports navigation into further investigation.
Results
The Triage Board gave the site a more structured way to manage machine health events:
Supports a repeatable triage process in a high-volume environment.
Gives analysts a common view of events across multiple OEM systems.
Helps reduce reliance on individual analyst experience when deciding what needs attention.
Makes recurring event patterns easier to spot.
Connects triage directly to deeper investigation.
Provides a foundation for continuously refining triage rules as the site learns more about its equipment.
Most importantly, the focus shifted from managing the volume of events to identifying the events that support a maintenance decision.
Summary
The goal wasn't another dashboard or more alarms to look at. It was to create a structured path from high-volume machine data to a meaningful decision.
Instead of asking: “Did something happen?” the process helps the team ask: “Does this pattern matter, and what should we do next?”
That is where a connected asset health approach becomes valuable: making complex equipment data more useful to the people responsible for keeping the fleet operating safely and effectively.
Frequently Asked Questions
-
MTS helped a surface and underground gold mine in Nevada sort tens of thousands of daily health events using two checks: frequency and duration. Both rules are set in the AHC Cookbook. An event is flagged if it occurs more often than the configured threshold, or persists longer than the configured average duration. A single alarm rarely tells you much. The pattern does.
-
MTS built the Events Triage Board for a Nevada gold mine already producing tens of thousands of health events a day, so another alarm list was the last thing the site needed. Instead, the board ranks events by how often they recur and how long they last. Each flag then links straight into four investigation tools, from high-resolution datalogger data to haul road context.
-
MTS brought events from CAT VIMS, Komatsu VHMS, Sandvik Optimine, Newtrax, VisionLink and iTrack into one view for a large gold mine in Nevada. Each system describes the same issue differently. In the AHC Cookbook, analysts standardise event descriptions, severity, categories, component mapping and machine classes, so "785C", "Cat 785C" and "CAT785C" become one machine class. Less decoding. More time on the equipment.
-
You can, but it gets hard to manage as reporting grows. When the same threshold is built into several reports, changing it means finding every copy. MTS keeps trend limits and event rules in the Asset Health Cookbook instead. Analysts change a threshold once, and the Trend Exception Tool, Equipment Data Interface and reports pick it up after the next scheduled refresh.
